
Imagine you are standing in a crowded room where everyone is screaming "Sell!" You feel the panic in your gut. Your instinct screams to join the chorus and run for the exit. But what if that exact moment of collective terror is actually the best time to buy? This is the core paradox of Contrarian Investing combined with Sentiment Analysis. It sounds counterintuitive, even dangerous, but data suggests it works when executed with discipline.
You might be thinking, "Isn't going against the crowd just a way to lose money faster?" Sometimes, yes. But modern tools allow us to measure crowd emotion objectively rather than guessing. By analyzing news headlines, social media chatter, and survey data, investors can identify when fear or greed has pushed prices away from reality. This guide breaks down how to use these signals without becoming a victim of them.
The Psychology Behind the Trade
Markets aren't rational machines; they are collections of humans making emotional decisions. Behavioral finance tells us that we hate losing money far more than we like making it. Dr. Hersh Shefrin’s research highlights that the pain of a loss hits about 2.25 times harder than the pleasure of an equivalent gain. This asymmetry drives extreme behavior. When stocks drop, people don't just sell; they panic-sell at any price. When stocks rise, they don't just buy; they FOMO (fear of missing out) into overvalued assets.
Warren Buffett famously said, "Be fearful when others are greedy, and greedy when others are fearful." For decades, this was intuition. Today, it's data. We can quantify "greed" and "fear" using specific metrics. The goal isn't to predict the future perfectly but to recognize when the current price reflects emotion rather than fundamental value. If the crowd is terrified, the asset might be on sale. If the crowd is euphoric, the asset might be expensive.
Key Indicators You Can Actually Use
You don't need a Bloomberg terminal costing $24,000 a year to start. Several accessible indicators reveal market mood. Here are the ones that matter most:
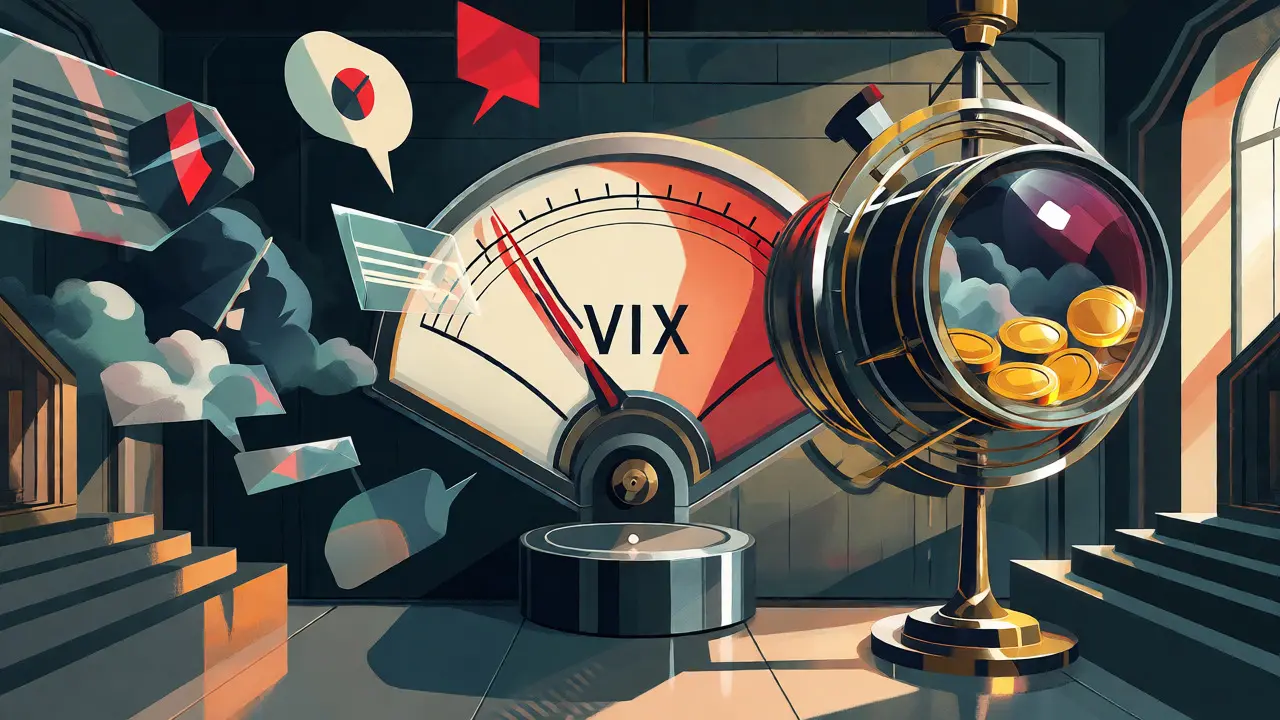
- VIX (Volatility Index): Often called the "fear gauge," the VIX measures expected volatility in the S&P 500. Readings above 30 typically signal extreme fear, while readings below 15 suggest complacency. High VIX often marks bottoms; low VIX often marks tops.
- AAII Sentiment Survey: Published weekly since 1987, this survey asks retail investors if they are bullish, bearish, or neutral. Historical data shows that when bullish sentiment exceeds 57.5%, the S&P 500 has delivered negative returns over the next month 63% of the time. Conversely, high bearish sentiment often precedes rallies.
- Put/Call Ratio: This compares options trading volume. A ratio above 1.0 means more puts (bets on decline) are being bought than calls (bets on rise), indicating bearish extremes. Contrarians view this as a potential buying opportunity.
- Bullish Percent Index (BPI): This tracks the percentage of stocks on major indices showing bullish technical signals. A reading below 30% indicates oversold conditions, suggesting the market is beaten down too far.
These aren't crystal balls. They are probability markers. No single indicator guarantees success, but when multiple signals align-like high VIX, low BPI, and extreme bearish AAII sentiment-the odds shift in favor of the contrarian.
How Sentiment Analysis Works in Practice
Sentiment analysis uses natural language processing (NLP) to scan millions of data points. It reads news articles, tweets, Reddit posts, and earnings call transcripts. Tools like RavenPack or free alternatives like StockTwits assign scores to this text. Positive words get positive scores; negative words get negative scores. Aggregated, this creates a real-time map of market mood.
Consider the case of Meta Platforms (META) in early 2023. Sentiment toward big tech was abysmal due to fears about AI spending and ad revenue declines. Social media chatter was overwhelmingly negative. However, fundamental analysts noted that Meta’s cash flow remained strong, and its user base was still growing. A contrarian investor seeing extreme bearish sentiment combined with reasonable valuation multiples (trading below its 10-year average P/E) might have entered a position. As sentiment normalized and AI narratives shifted to optimism, META rose significantly. The mispricing wasn't because the company changed overnight; it was because the crowd’s emotion exaggerated the risks.
This approach requires layering timeframes. Short-term sentiment (daily social media spikes) can be noisy. Medium-term sentiment (weekly news cycles) is more reliable. Long-term sentiment (quarterly institutional surveys) helps confirm the trend. Discrepancies between these layers offer clues. If short-term fear is extreme but long-term fundamentals remain solid, that gap represents opportunity.
Contrarian vs. Trend-Following: Which Wins?
Trend-following strategies ride momentum. If a stock goes up, you buy. If it goes down, you sell. This works well in stable bull markets. From 2017 to 2019, pure trend-following outperformed contrarian strategies. But during volatile periods like 2020-2022, contrarian approaches outperformed by nearly 19% annually according to Trustnet backtests. Why? Because trends eventually exhaust themselves. Sentiment extremes mark those exhaustion points.
| Feature | Contrarian Sentiment | Trend-Following | Traditional Value |
|---|---|---|---|
| Core Philosophy | Buy fear, sell greed | Ride the wave | Buy undervalued assets |
| Primary Signal | Emotional extremes (VIX, Surveys) | Price movement (Momentum) | Fundamental metrics (P/B, DCF) |
| Best Market Condition | High volatility / Panic | Stable bull markets | Long-term holding |
| Main Risk | Catching falling knives | Buying tops / Selling bottoms | Value traps |
| Time Horizon | Medium-term (weeks/months) | Short to Medium-term | Long-term (years) |
Note that traditional value investing focuses on intrinsic worth regardless of mood. Contrarian sentiment specifically targets mispricings caused by mood. An energy stock might trade below book value (value signal), but if sentiment is still collapsing, the price could drop further. Sentiment analysis adds the timing element that pure value investing often lacks.
Pitfalls: When Being a Contrarian Hurts
Going against the crowd isn't always right. Sometimes the crowd is correct. The biggest risk is "catching a falling knife." In 2000, many contrarians bought tech stocks at VIX levels above 40, thinking they were cheap. They weren't. Tech valuations were still insane, and prices fell another 40%. How do you distinguish between a temporary dip and a structural collapse?
Context matters. Ask yourself: Is the negativity driven by temporary bad news or permanent business model failure? During the 2020 oil crisis, energy stocks traded at price-to-book ratios below 0.6. Many had strong balance sheets and survived the crash. Buying there worked. But consider retail stocks in 2021-2022. Sentiment turned bearish as e-commerce took share. Early contrarians bought retail names, only to see them continue sliding for years. The sentiment signal was accurate, but the fundamental thesis was broken.
To avoid this, never rely on sentiment alone. Combine it with fundamental analysis. Look for companies with healthy cash flows, manageable debt, and competitive advantages. If sentiment is terrible but the business is sound, you likely have a contrarian opportunity. If sentiment is terrible and the business is dying, stay away.

Implementation: Tools and Tactics
You don't need complex algorithms to start. Begin with free resources. The CNN Fear & Greed Index provides a simple daily snapshot. The AAII survey offers weekly retail sentiment data. For deeper dives, platforms like StockTwits provide community sentiment scores for individual stocks. Premium tools like RavenPack ($1,200-$5,000 monthly) offer institutional-grade NLP analysis, but they are overkill for beginners.
Here is a practical workflow:
- Monitor Indicators: Check VIX and AAII weekly. Note when readings hit historical extremes (e.g., VIX > 30, Bullish % < 30%).
- Screen for Candidates: Look for quality companies in sectors experiencing extreme negative sentiment. Filter by financial health (low debt, positive cash flow).
- Verify Fundamentals: Ensure the negative sentiment isn't justified by deteriorating earnings. Read recent earnings calls and analyst reports.
- Enter Gradually: Don't go all-in. Buy small positions (1-3% of portfolio). Add more if sentiment worsens but fundamentals hold.
- Set Exit Rules: Decide beforehand when you will sell. Perhaps when sentiment turns neutral or bullish, or after a fixed time period (e.g., 6 months).
Discipline is harder than analysis. When you buy during a crash, your portfolio will likely drop further before it rises. You must stick to your plan despite paper losses. Successful contrarians treat this as a systematic process, not a gamble.
The Future of Sentiment Trading
Institutional adoption is accelerating. Greenwich Associates reports that 47% of quantitative hedge funds now use sentiment analysis. AI models are getting better at understanding context. RavenPack’s Context AI claims 89.7% accuracy in predicting market direction by analyzing nuanced language, compared to 72% for older methods. This doesn't mean easy money. As more players use these tools, the edge shrinks. AQR Capital found that pure sentiment strategies underperformed slightly from 2010-2020 due to increased efficiency.
However, human bias persists. Vanguard studies show loss aversion hasn't changed since the 1980s. As long as humans make market decisions, emotions will create mispricings. The key is combining automated sentiment signals with human judgment on fundamentals. Technology identifies the anomaly; you determine if it’s an opportunity or a trap.
What is the main risk of contrarian investing with sentiment?
The primary risk is "catching a falling knife," where an asset continues to decline despite appearing oversold. Sentiment can remain negative longer than expected, especially if fundamental issues exist. Mitigate this by combining sentiment signals with fundamental analysis and strict stop-loss rules.
Do I need expensive tools to track sentiment?
No. Free resources like the CNN Fear & Greed Index, AAII Sentiment Survey, and VIX data provide valuable insights. Paid tools like RavenPack offer deeper NLP analysis but are typically reserved for institutional investors or serious professionals.
How does sentiment analysis differ from technical analysis?
Technical analysis focuses on price charts and volume patterns. Sentiment analysis measures investor emotion through text data (news, social media) and surveys. While technicals show what is happening to price, sentiment reveals why, helping identify emotional extremes that may reverse.
Can sentiment analysis work in crypto markets?
Yes, arguably even better. Crypto markets are highly speculative and driven by retail sentiment. Tools tracking Twitter/X activity, Reddit discussions, and funding rates often correlate strongly with price swings. Extreme fear or greed in crypto frequently precedes significant reversals.
Is contrarian investing suitable for beginners?
It requires psychological resilience. Beginners should start with small allocations and focus on learning to interpret indicators before risking significant capital. Paper trading sentiment strategies for 6-12 months is recommended to build confidence and discipline.